Analytics
Both halves of the work, measured: who you reached out to, and how what you published did.
What is on this page
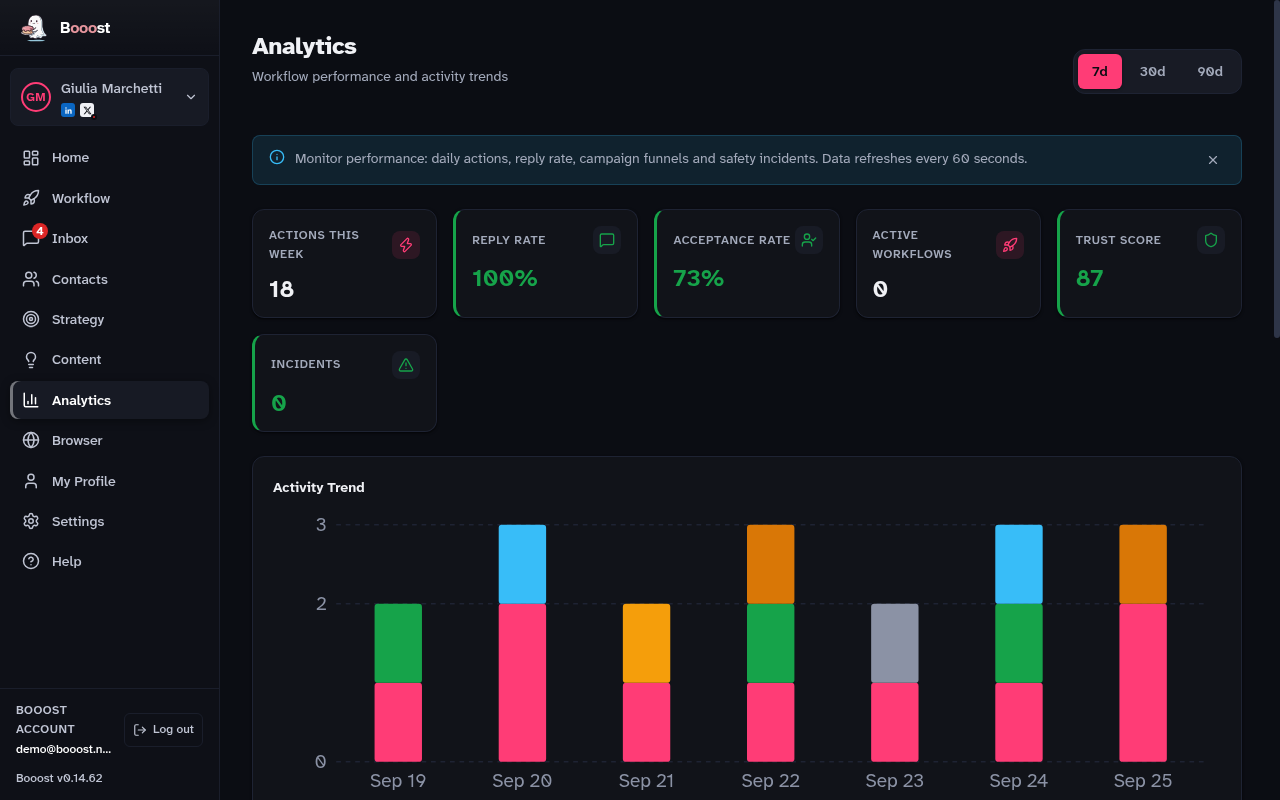
- Daily actions by type, as bars
- Messages sent versus received, as lines
- Published posts — reactions, comments and shares
- Campaign funnel — how many profiles passed through each node
- Reply rate and connection acceptance
- Incident log for safety events
The funnel is the part you use
The funnel shows how many profiles went through each node of the workflow. It is good for one thing, and it is the most useful thing on this page: seeing where people stop.
A node that takes in a hundred profiles and passes ten to the next one is telling you something about that node, not about the profiles.
Published posts
This covers the other half of the product: not who you contacted, but how what you published did. It shows the totals for the chosen period, the five posts with the most response and — for posts born from the editorial pipeline — which theme performs.
That distinction earns its place: knowing which seam produces posts that work is more useful than knowing which single post worked.
The same numbers appear on every published post under Content → Posts, next to the post itself.
Where the numbers come from, and two consequences
Booost reads them from LinkedIn, on your posts, going through the same anti-ban read budget as every other read.
Impressions are not here, and that is a choice
LinkedIn declares the field and leaves it empty on every post we have measured; the per-post statistics page denies access even on your own posts.
Showing "0 impressions" on a post that had a thousand would be worse than showing nothing.